Story at-a-glance
- You’re 3x more likely to become disabled than to die before retirement—yet most people only carry life insurance.
- Disabilities can last months or years, and 1 in 7 people age 35–65 will be disabled for 5+ years.
- Common causes include heart disease, back problems, arthritis, asthma, and mental health conditions.
- Disability can hit your finances hard—it’s the cause of nearly half of all home foreclosures.
- Disability insurance protects your income so you can avoid financial disaster if you’re too sick or injured to work.
What are your odds of a disabling injury or illness?
You probably insure your home, your car and other personal assets. But what about the income that provides those assets? You might be surprised to learn what poses the greatest threat to most people during the course of one year. Consider these disability insurance statistics:
| Odd for risks | Covered by Insurance |
|---|---|
| 1 out of 5 | That your auto will be damaged in an accident |
| 1 out of 21 | That you will have a disabling accident |
| 1 out of 96 | That you will have a fire |
| 1 out of 114 | That you will die |
Source: Field Guide 2001, National Safety Council, World Almanac
Source: Health Insurance Association of America, 2000
Source: Source: Health Insurance Association of America, The New York Times, February 2000
Are you planning a Long Vacation?
You probably plan ahead, even for a short vacation. But, you may not have planned ahead for an unexpected “vacation”… a long-term disability. The conditions listed below could leave you unable to work for a month, six months, or even longer.
| Conditions Causing Limitation | Number (in thousands) | Percent of All Conditions |
|---|---|---|
| Heart Disease | 7,932 | 13.0 |
| Deformities, orthopedic impairments & disorders of the spine or back | 7,672 | 12.6 |
| Osteoarthritis and allied disorder | 5,048 | 8.3 |
| Orthopedic impairment of lower extremity | 2,817 | 4.6 |
| Asthma | 2,592 | 4.2 |
| Diabetes | 2,569 | 4.2 |
| Mental Disorders | 2,035 | 3.0 |
| Cancer | 1,342 | 2.2 |
Source: Health Conditions and Impairments Causing Disability, US Department of Education. National Institute on Disability and Rehabilitation (NIDRR). Abstract No.16, Table 2, September, 1996
Most likely, you realize the need for life insurance – you know you’re going to die, and planning for the well being of your family upon the event of your death is not often questioned. Planning for a disability shouldn’t be any different. Especially since your chance of becoming disabled before age 65 is greater than your chance of dying.
| Age | Number of Disabilities per 1000 Lives* | Number of Deaths per 1000 Lives* | Disability vs. Death Ratio |
|---|---|---|---|
| 27 | 5.17 | 1.46 | 3.54 to 1 |
| 32 | 5.36 | 1.64 | 3.27 to 1 |
| 37 | 7.45 | 2.14 | 3.48 to 1 |
| 42 | 10.22 | 3.22 | 3.17 to 1 |
| 47 | 13.93 | 4.68 | 2.98 to 1 |
| 52 | 17.52 | 6.82 | 2.57 to 1 |
| 57 | 23.02 | 10.23 | 2.25 to 1 |
* 1985 Commissioner’s Individual Disability Table B, 1980 CSO
Disability Plays No Favorites
With Disability Income Insurance you can feel secure in knowing that you are protecting your most valuable asset – your ability to work and earn an income. Avoid the financial strain even a short-term disability can cause when you’re sick or hurt to work.
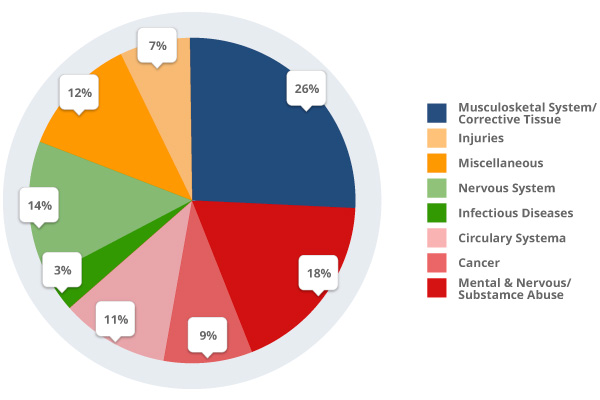
The causes of disability may surprise you! Here is a breakdown (by percentage of claims) of some typical reasons an individual may become disabled

48% of all home foreclosures are the result of disability, while only 3% of all foreclosures result from death.
Source: Principal Life Disability insurance claims incurred as of March 2009. The above is for illustration purposes only and its not intended as an inclusive representation of all claims.
FAQs
Am I really at risk of becoming disabled?
Yes. A 20-year-old has a 1 in 4 chance of becoming disabled before retirement. You’re more likely to become disabled than to die during your working years.
How does the risk of disability compare to other risks?
You’re:
- 3.5x more likely to need disability insurance than life insurance
- 4x more likely to have a disabling injury than a house fire
- More likely to have your car damaged than to die in a given year
What are common causes of disability?
Heart disease, back and spine issues, arthritis, asthma, diabetes, mental illness, and cancer are all leading causes.
What age group is most at risk?
Disability risk grows with age, but even at 32, you’re over 3x more likely to become disabled than to die.
How long can disabilities last?
About 30% of people ages 35–65 will face a disability lasting at least 90 days—and 1 in 7 will be disabled for 5 years or more.
How does disability impact finances?
Disability causes 48% of all home foreclosures—compared to just 3% caused by death. Without income, savings can disappear fast.
How does disability insurance help?
It replaces part of your income if you can’t work due to illness or injury—helping you cover bills and avoid financial disaster.
Ready to protect your future?
Get a personalized side-by-side policy comparison of the leading disability insurance companies from an independent insurance broker.


